Razor Precision — Buy/SellRazor Precision Stock Action Indicator
The Razor Precision indicator is an advanced, multi-layered market analysis tool designed for traders who demand accuracy and alignment across multiple timeframes. It combines price action, moving average crossovers, volume confirmation, swing structure mapping, and indicator confluence (RSI, MACD, ATR, OBV) to generate actionable buy/sell strength ratings.
Key Features:
Price Action Detection: Identifies higher highs/lows (uptrend) and lower highs/lows (downtrend).
MA Crossover Momentum: Monitors 50/200 moving average crossovers to detect trend shifts.
Volume Surge Analysis: Confirms breakouts or pullbacks with significant volume spikes.
Swing Structure Tracking: Maps internal/external breaks to align with Smart Money Concepts.
Indicator Confluence: Aggregates signals from RSI, MACD, ATR, and OBV for precision confirmation.
Multi-Timeframe Alignment: Compares trends across 15m, 1H, 4H, and Daily charts for stacked or conflicting signals.
Strength Levels: Signals range from SELL, STRONG SELL, ULTRA STRONG SELL to BUY, STRONG BUY, ULTRA STRONG BUY.
Dynamic Table Display: Updates every 5 minutes or when overall action changes, showing per-timeframe analysis and the aggregated decision.
Ideal for swing traders, scalpers, and intraday momentum players who want high-confidence trade direction filtered through multiple technical layers.
Pesquisar nos scripts por "ma cross"

MARibbonMARibbon インジケーターについて
この「MARibbon」は、3本の移動平均線(MA1、MA2、MA3)を描画し、特にMA2とMA3の関係性に注目して、背景色でトレンドの強弱や転換のサインを視覚的に分かりやすく表示するインジケーターです。
主な特徴
3種類の移動平均線を表示可能
MA1(白色、期間40、太さ2)
MA2(水色、期間200、太さ4)
MA3(ピンク色、期間800、太さ4)
各MAの期間・種類(SMA、EMA、WMA、RMA)・タイムフレームは自由に設定可能。
MA2とMA3の関係性に応じて、チャート背景に色付きのリボン(帯)を表示。
背景リボンの意味
MA2 > MA3(ゴールデンクロス状況)
→ 背景を薄い緑色にして、上昇トレンドの可能性を示唆。
MA3 > MA2(デッドクロス状況)
→ 背景を薄い赤色にして、下降トレンドの可能性を示唆。
それ以外(等しい場合など)は背景色なし(透明)で表示。
入力可能な設定
各移動平均線の期間
各移動平均線の種類(SMA、EMA、WMA、RMA)
各移動平均線のタイムフレーム(デフォルトはチャートと同じ)
使い方
任意の銘柄・時間足のチャートにインジケーターを適用。
必要に応じて、3本の移動平均の期間・種類・時間足を調整。
MA2とMA3の位置関係によって、チャート背景の色が変わり、トレンドの強弱を直感的に把握可能。
MARibbon is a custom indicator that plots three moving averages (MA1, MA2, MA3) and visually fills the space between MA2 and MA3 with color bands to indicate trend strength and direction.
Each MA supports custom type (SMA / EMA / WMA / RMA), length, and timeframe.
A green band appears when MA2 is above MA3.
A red band appears when MA3 is above MA2.
This clean and minimal design helps traders easily visualize overlapping trends and potential crossovers.
💡 Use Cases:
Visually confirm confluence of long- and short-term trends
Identify ribbon-like zones of trend strength
Support for MA cross strategy analysis

Another EMA trend indicator"Another EMA Trend Indicator" is a dynamic trend-following tool. Blending customizable Moving Averages (EMA or SMA) with an automated, visualized trade management system. It identifies bullish and bearish trend shifts based on short- and long-term MA crossovers, dynamically calculates optimal entry points, stop-losses, and take-profits, and visually manages trades on the chart with optional clouds, lines, and labels.
Main Features:
Moving Average Trend Detection:
Choice between EMA (Exponential Moving Average) or SMA (Simple Moving Average).
Two customizable lengths: a short MA and a long MA.
Detects bullish and bearish switches based on MA crossover events.
Entry, SL, and TP Calculation:
Entries are calculated dynamically after a signal using a combination of historical candle high/low analysis and a risk divider.
Stop-loss and take-profit levels are automatically set based on the trend's recent volatility and user-defined risk parameters.
Supports fixed or dynamic profit targets.
Risk Management Settings:
Define minimum and maximum acceptable profit percentages.
Set maximum stop-loss distance and apply a stop-loss multiplier for added flexibility.
Limit maximum trade duration to avoid endless open trades.
Trade Visualization:
Optional debug mode to display:
Entry, stop-loss, and take-profit lines.
Buy/sell signals via shapes on the chart.
Trend cloud between short and long MAs.
Historical trend levels for better visualization.
Dynamic Statistics Panel:
Real-time display of:
First trade date.
Total number of trades.
Number of profitable and losing trades.
Average and maximum trade duration.
Win rate and average profit/loss percentages.
Inputs:
MA Type: Choose between "EMA" or "SMA."
Short/Long MA Length: Customize lengths to control sensitivity.
Source: Apply to typical price values like hl2.
Risk Settings:
Minimum, maximum, and fixed profit percentages.
Stop-loss settings and risk dividers.
Trade Behavior Settings:
Max trade length.
Visualization Toggles:
Show/hide debug labels, lines, clouds.
Use Case:
This indicator is ideal for trend-following traders who prefer a semi-automated trading framework. It helps maintain consistency in entries and exits while visualizing important trend dynamics and trade health directly on the chart.
Best suited for swing trading crypto coins.

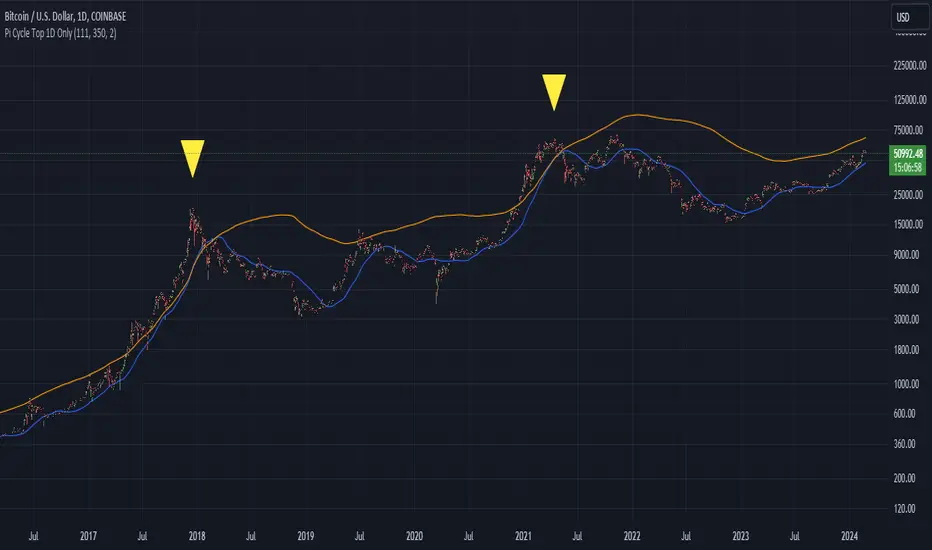
Bitcoin Pi Cycle Top Indicator - Daily Timeframe Only1 Day Timeframe Only
The Bitcoin Pi Cycle Top Indicator has garnered attention for its historical effectiveness in identifying the timing of Bitcoin's market cycle peaks with remarkable precision, typically within a margin of 3 days.
It utilizes a specific combination of moving averages—the 111-day moving average and a 2x multiple of the 350-day moving average—to signal potential tops in the Bitcoin market.
The 111-day moving average (MA): This shorter-term MA is chosen to reflect more recent price action and trends within the Bitcoin market.
The 350-day moving average (MA) multiplied by 2: This longer-term MA is adjusted to capture broader market trends and cycles over an extended period.
The key premise behind the Bitcoin Pi Cycle Top Indicator is that a potential market top for Bitcoin can be signaled when the 111-day MA crosses above the 350-day MA (which has been doubled). Historically, this crossover event has shown a remarkable correlation with the peaks of Bitcoin's price cycles, making it a tool of interest for traders and investors aiming to anticipate significant market shifts.
#Bitcoin
[blackcat] L4 Adaptive Hull Suite 4HLevel: L4
Function Description:
The L4 Adaptive Hull Suite 4H aims to help traders identify trend reversals and trade signals using various moving averages and indicators. The script is designed to be adaptable and customizable, allowing traders to tweak the settings to suit their individual preferences and trading styles.
At its core, the script uses the hybrid Hull Moving Average (HHMA), a popular technical indicator that aims to reduce lag and noise while improving the accuracy of moving average signals. The HHMA is combined with a reverse chop indicator, which helps identify trend reversals by measuring the volatility of the market and comparing it to a set threshold.
In addition to the HHMA and reverse chop indicators, the script also includes customized open-close cross (OCC) conditions and a hybrid Hull Moving Average (Hybrid Hull MA). The OCC conditions allow traders to generate buy and sell signals based on the cross of the open and close prices, while the hybrid Hull MA combines the HHull MA with other moving averages to provide a more accurate and reliable trend-following signal.
Traders can adjust the settings of the script to suit their trading style and risk appetite. For instance, the chop length, ATR length, and reverse chop threshold can be customized to identify trend reversals more accurately, while the Hull MA length can be adjusted to provide a faster or slower response to price changes.
Overall, the L4 Adaptive Hull Suite 4H is a powerful and flexible Pine script that can help traders identify trend reversals and generate accurate buy and sell signals. With its customizable settings and reliable indicators, the script can be a valuable addition to any trader's toolkit.
About Time Frame:
The L4 Adaptive Hull Suite 4H is specifically designed for use on the 4-hour time frame and is particularly well-suited for trading the BTCUSDT.P trading pair. The script combines various technical indicators, including the Adaptive Hull Moving Average (AHMA) and the reverse chop indicator, to help identify trend reversals and generate accurate buy and sell signals.
Traders who are interested in using the L4 Adaptive Hull Suite 4H should be aware that it is optimized for use on the 4-hour time frame. While it may work on other time frames, the signals generated may not be as reliable as those generated on the 4-hour chart. Additionally, the script is specifically designed for use on the BTCUSDT.P trading pair, and may not be as effective on other trading pairs.
Overall, the L4 Adaptive Hull Suite 4H is a powerful and adaptable Pine script that can help traders identify trend reversals and generate accurate buy and sell signals. With its focus on the 4-hour time frame and the BTCUSDT.P trading pair, the script can be a valuable tool for traders who are looking to improve their trading results on this particular asset.
Choppiness Sensitive
The L4 Adaptive Hull Suite 4H includes a choppiness detection feature that helps traders identify whether the market is trending strongly or moving sideways. When the market is trending strongly, the background color of the chart will turn blue, indicating an active buy or sell signal. Conversely, when the market is moving sideways, the script will ignore any buy or sell signals generated by the OCC or Hull MA conditions.
The choppiness detection feature is based on the reverse chop indicator, which measures the volatility of the market and compares it to a set threshold. When the chop value is above the threshold, the market is considered to be in a sideways or choppy phase, and the script will not generate any buy or sell signals. However, when the chop value is below the threshold, the market is considered to be trending strongly, and the script will generate active buy or sell signals based on the OCC or Hull MA conditions.
Overall, the choppiness detection feature is a valuable addition to the L4 Adaptive Hull Suite 4H, as it helps traders identify the optimal times to enter and exit the market. By focusing on strong trends and ignoring sideways movement, traders can improve their trading results and minimize their risk of losses.
Divergence Detection and Alerts
The L4 Adaptive Hull Suite 4H is a powerful Pine script that can produce divergence labels and TradingView alerts using the built-in alert() function. This allows traders to receive real-time notifications when the script generates a buy or sell signal, making it easier to stay on top of market movements and take advantage of profitable trading opportunities.
To set up alerts, traders can simply add the alert() function to the script and specify the conditions that should trigger the alert. For instance, traders may want to receive an alert when the script generates a buy signal based on the OCC conditions, or when the Hull MA crosses above or below a certain level.
In addition to alerts, the script can also produce divergence labels, which can help traders identify potential trend reversals and generate more accurate buy and sell signals. Divergence labels are based on the difference between the script's indicators and the price action of the asset being traded, and can provide valuable insights into the underlying market dynamics.
Overall, the L4 Adaptive Hull Suite 4H is a versatile and customizable script that can help traders identify trend reversals and generate accurate buy and sell signals. With its ability to produce alerts and divergence labels, the script can be a valuable tool for traders who are looking to stay on top of market movements and take advantage of profitable trading opportunities.

Actieve Inversiones EMABBOL by EDOHEN
EMABBOL includes these indicators:
- triple emas (9,21,50)
- Bollinger Bands
- Also includes buying or selling signals
The following strategy is based on ema crosses and bollinger ma crosses, the Bollinger band gives us the target we could expect from our trades, using the upper and lower bands.
Trading criteria
Buy : Price crosses over the triple emas and also crosses under the Bollinger band ema. Looking for 3:1 PnL
Sell : Price crosses under the triple emas and also crosses under the Bollinger band ema. Looking for 3:1 PnL
Stop Loss Tips : set the SL above the crosses if Selling, below the crosses if buying
Take Profit Tips : set the TP below the Bollinger's lower Band band if Selling, or above the Bollinger's upper Band band if Buying

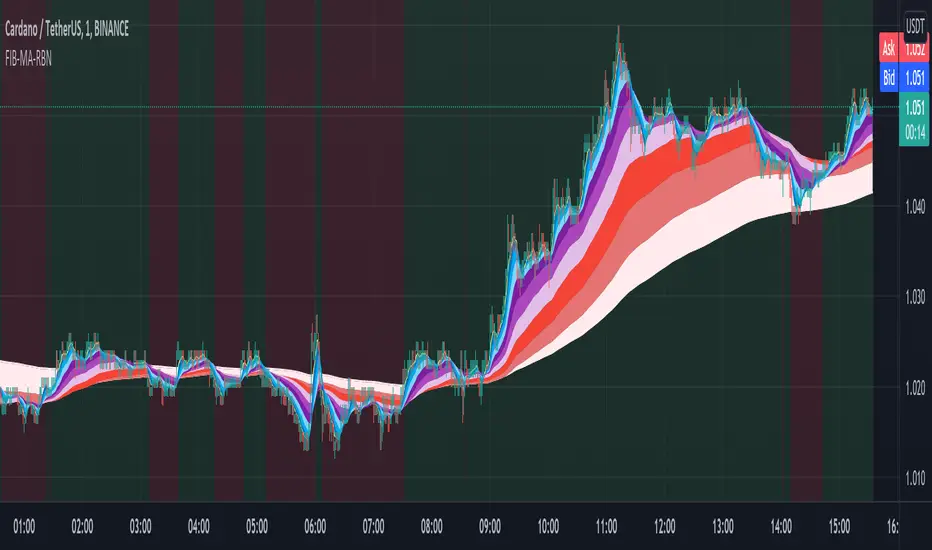
Fibonacci Muti-MA RibbonWelcome some, welcome small.... This is CryptoFilio, your dark knight in the crypto light - shining down my infinite wisdom upon this wasteland we call the "markets". It's me and you against the machine... so rage, rage, rage against the dying of the night!
DESCRIPTION
This indicator exemplifies the beauty of the sacred Fibonacci sequence.... used by flowers and seashells and the intrepid day trader. Each color in the ribbon represents an MA of a specific FIB lookback period. This naturally makes the ribbon front weighted, giving recent price action greater importance than older price action. The undulating curls of the ribbon allow a trader to see key convergences and divergences. The ribbon often narrows before a major price movement.
The background is lightly colored to indicate when one average of MA's crosses the other average (1+2+3+4+5) crosses (6+7+8+9+10). Like a standard MA cross, but a little more sophisticated.
The most visually pleasing is SMMA-RMA, but the more effective in anticipating the market is EMA and HMA.
USAGE
Visualizing convergence and divergence as the ribbon widens with sudden price movement and narrows during consolidation
Visualizing general trends as the flipping over of the ribbon represents a general trend change
Setting possible entry and exit points through the width and direction of the ribbon
VARIATIONS
You can select many types of MA's, such as SMA,EMA,HMA,VWMA... and a couple of others. The most effective seem to be EMA,HMA, and VWMA
SUGGESTIONS
Let me know if you'd like some other features added to this indicator, such as additional MA's or something else. I can also customize it for a specific application.
Binary Sniper StrategyBy using this indicator you can better view the MA indicators used by this strategy, as well as specifically waiting for the cross and close which gives you easy access to an arrow as one of the confirmations and having the ability to setup alerts on the flip so you can easily monitor multiple pairs at the same time, the Bands give you a general idea of the market flow, and volatility.
The Long Term EMA gives you higher probability trend for a easier binary clear, potentially without the need for a rollover.
This is best used alongside:
- Stochastic Indicator with the Settings of (5,3,3)
The confirmations are :
- Are we Above or Below the Long Term Trend EMA - (Above = 1 Confirmation for the Buy, Below = 1 Confirmation for the Sell)
- Are we at the Low or the High of the Bands ( Low = 1 Confirmation for the Buy, High = 1 Confirmation for the Sell)
- Are the MAs crossed up or down( Cross Up = 1 Confirmation for the Buy , Cross Down = 1 Confirmation for the Sell)
- Are we coming out of the Oversold or Overbought areas on the Stoch (Oversold = 1 Confirmation for the Buy, OverBought = 1 Confirmation for the Sell)
- Is the 15 min in Confluence ? = (Yes = 1 Confirmation in either direction)
Once You have at least 3 Confirmations one of them having to be the MA cross arrow popping up, you have a valid trade setup on the open of that candle, for Binary options, I personally like to wait a little bit after the arrow candle opens to potentially get a slight pullback so that i can buy/sell with a slightly better entry that i don't have to rollover on, I usually aim for 3 min clears, but sometimes i have to rollover.

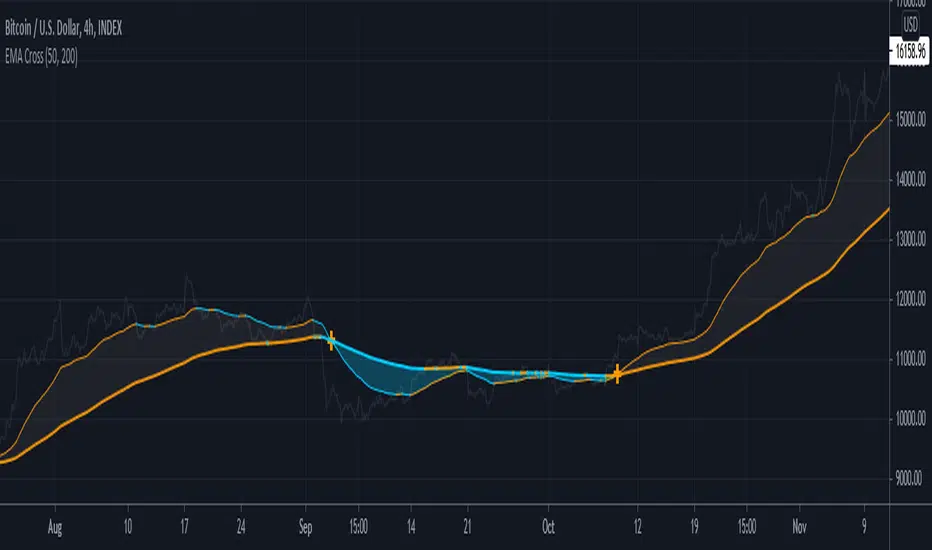
EMA CrossColor coded Fast & Slow Moving Averages. Cross printed at MA cross. MA color changes when price moves above / below MA.
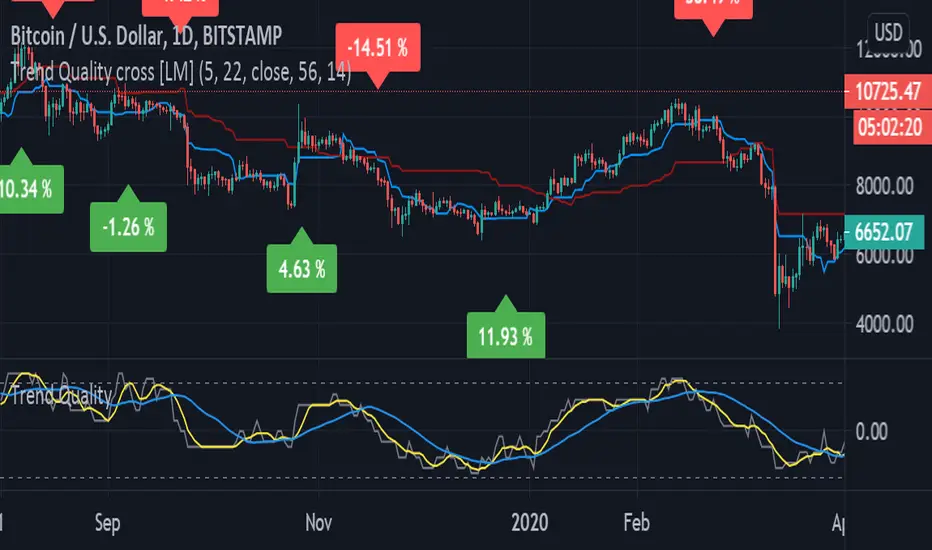
Trend Quality cross [LM]Hi Guys,
I would like to introduce you Trend quality cross indicator. The idea orginallybcomes from @kruskakli and his indicator "Trend Quality" so shout-out to him
I have modified the indicator to display just binary option buy/sell and display diff percentage from previous cross. Also there is a difference that I have double smoothed tq indicator results to give less false signals.
and also added for the same reason like in my other indicator vpci ma cross base line and conversion line from ichimoku.
Any suggestions are welcomed
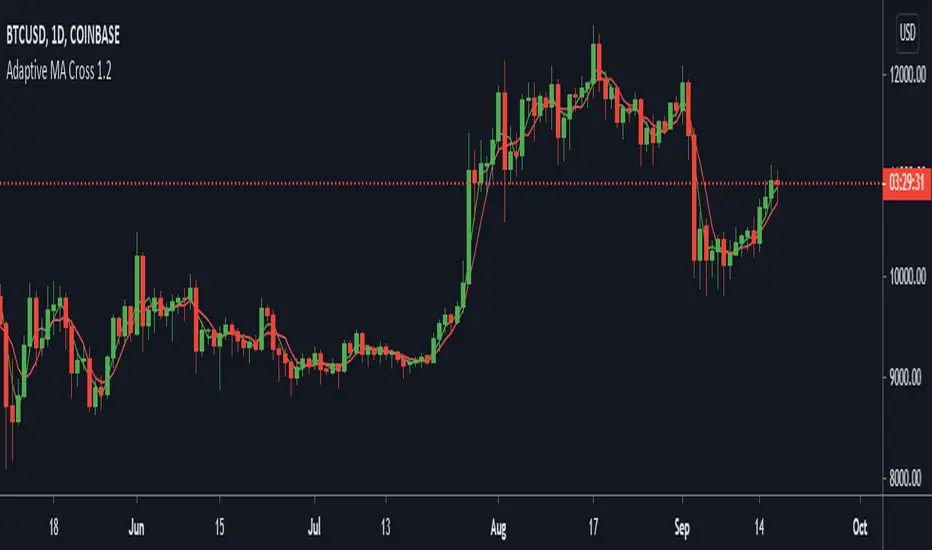
Adaptive MA CrossThis is part 5 of 11 in the system named Ninetales/Volt V2 you can find on Tradingview.
Add three values to test for Fast MA, and three for Slow MA and it will backtest a crossover strategy and show you the most accurate one.
WaveMasterThis indicator created with combination of 2 different indicator, momentum and Inchimoku Kinko Hyo.
It replicates the result of Moving Average(5) added to RSI indicator window to identify the end of a trend and reversal,
under strict condition and unique application on mobile phone.
But with more accuracy and reduced false signals.
Tested markets: DOWJONES/US30, S&P500, CURRENCY, Commodities: GOLD, BRENT & WTI.
For Intraday & Swing Trader.
How to use:
Two key signal levels, Overbought / Oversold level.
1. When the line touch Overbought level, go Short.
2. When the line touch Oversold level, go Long.
Timeframe: M5, H1 & H4
**After the line cross the signal level. You can wait for more confirmation such
ABC pattern, engulfing or additional MA crossing.
When to execute entry?
For example: So when line touch the signal level lets say it a Long signal, wait for ABC pattern, when you saw a complete wave of A and it making wave B,
use Fibonacci Retracement from the first point (B)(High) to second point (A)(Low), set BUY LIMIT at 50% of Fibonacci Retracement level for smaller risk, or wait for
wave C to break above the HIGH of wave B at 100% of Fibonacci Retracement level to instantly BUY at current price to confirm the ABC pattern.
When to exit your position?
1) Exit your trade when the line touch Overbought level, indicates the bullish is weakens.
2) Exit your trade when the price touch Fibonacci Retracement level of point B to A,
at these 3 level 161.8% / 261.8% / 423.6% (Take Profit level)

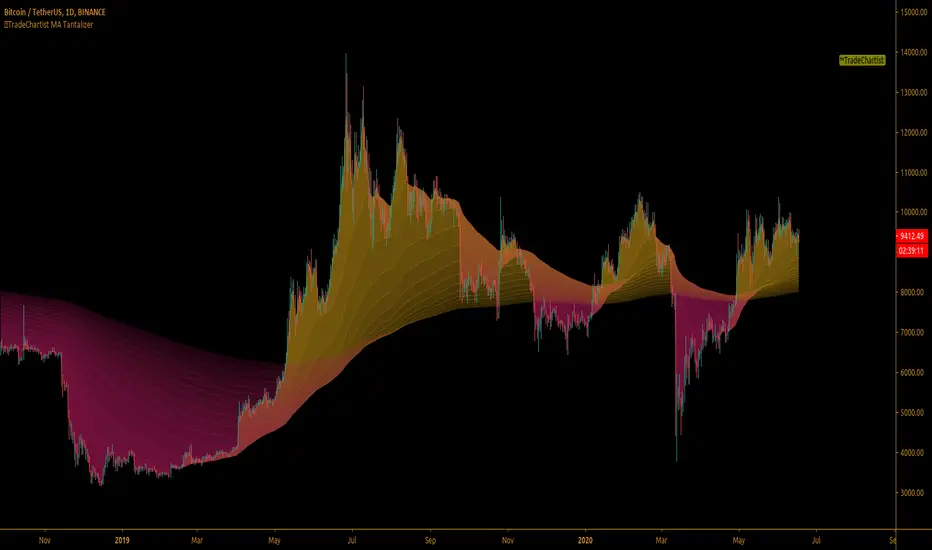
TradeChartist MA Tantalizer ™TradeChartist MA Tantalizer is a free to use, elegantly designed script for MA based traders and it offers a range of useful Moving Averages based plots including MA fishnet/Tantalizer ribbon and custom multi time frame MAs with crosses based on user input. The script's visually appealing design and its functionality offers a pleasing experience for the users, thereby complementing their analysis and helps understand asset's price action better.
What does ™TradeChartist MA Tantalizer do?
1. MA Tantalizer plots Moving Averages Tantalizer (Fishnet or Tantalized) in user preferred color scheme based on selection from a dropdown of 10 MAs ( SMA , EMA , Zero-Lag EMA , SMMA , WMA , DEMA , TEMA , VIDYA ( Variable Index DYnamic Average ), T3 MA (developed by Tim Tillson featured in his article "Better Moving Averages" in 1998), Modified T3 MA ). If length input is 10, Tantalizer plots 15 MA plots ranging from 10 MA to 150 MA. The Tantalized MAs help the traders to visually spot price trends and along with MTF (Multi Time Frame) MA plots with detection of crosses within the script, help traders make an informed trade decision. 15 MA plots can be individually plotted or hidden from the indicator settings.
2. Plots two MAs based on user input length and timeframe which helps detect MA crosses as shown below.
3. Generates Signal for MA crosses that can be plugged as Signal Connector and used with Plug and Trade scripts as below.
The sheer number of interesting things that can be done with this script from plotting visually engaging MA Tantalizer and detecting MA crosses not just on chart Timeframe, but also crosses between MAs of different timeframes, makes this script quite versatile and a real Tantalizer.
[JOHN] CROSSHello this is CROSS indicator. (work on ALTCOINS, BTC AND ETH)
---------------------------------
How this indicator work?
CROSS script work with MOVING AVERAGES and MA CROSS DISPLAYED ON CHART.
This system provide
- Possible buy/sell zones, to catch bull and bear cycle. (H4 AND D1 WORK PERFECTLY)
----> YELLOW BARS BUY
----> RED BAR SELL (TAKE PROFIT ON POSITION OR SHORT)
- Crossover of the 2 Moving averages ploting on chart with "GOLDEN CROSS" and "DEATH CROSS" with alert condition included if you want receive alerts.
BELOW SOME EXAMPLE WITH SOME COINS
Remember the rules and watch the charts below
YELLOW CANDLES = BUY
RED CANDLE = SELL
----------------------
LEO / BTC
MATIC / BTC
XTZ / BTC
LINK / BTC
ETH / BTC
ETH / USDT
BTC / USDT
THIS CAN BE USED WITH KNIFE CUT INDICATOR FOR HELP ON BIAS.
----------------------
i hope you like, if you have question please comment below
i will help you.
Thanks

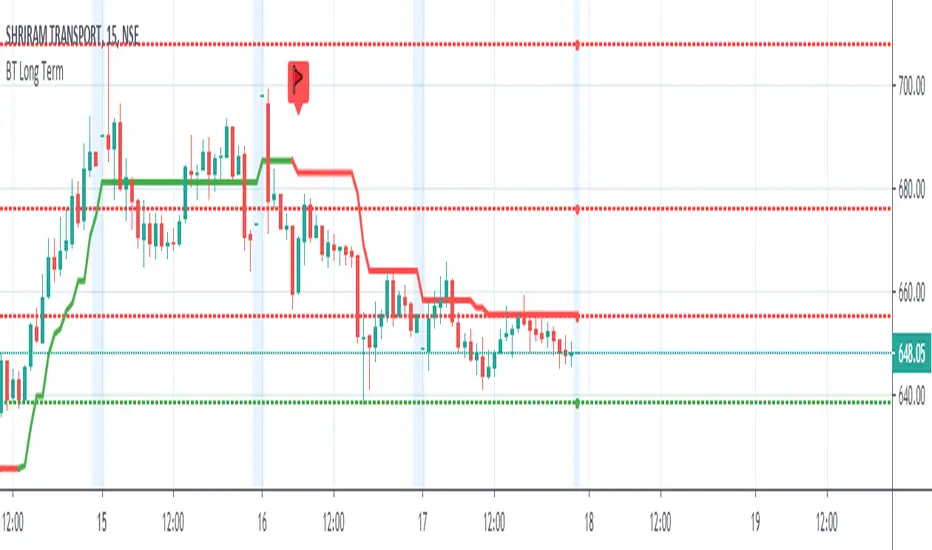
Badshai Trading Long TermLong Term Smart Money Expert is quick guide indicator for long term trade or swing trade
It has used 90 moving average and 144 moving average
Buy Signal generates on 90 MA crossover
Sell Signal Generates on 90 MA crossunder
This indicator needs Trend Lines +++ for better performance
Point and Figure (PnF) Moving AveragesThis is live and non-repainting Point and Figure Chart Moving Averages tool. The script has it’s own P&F engine and not using integrated function of Trading View.
Point and Figure method is over 150 years old. It consist of columns that represent filtered price movements. Time is not a factor on P&F chart but as you can see with this script P&F chart created on time chart.
P&F chart provide several advantages, some of them are filtering insignificant price movements and noise, focusing on important price movements and making support/resistance levels much easier to identify.
Moving averages on Point & Figure charts are based on the average price of each column while bar chart moving averages are based closing price. Average Price means (ClosePrice + OpenPrice) / 2.
Because of there is double smoothing, you should use shorter lengths for moving averages. Double smoothing means: using average price smooths once, using length greater than 2 smooths price second time.
If you are new to Point & Figure Chart then you better get some information about it before using this tool. There are very good web sites and books. Please PM me if you need help about resources.
Options in the Script
Box size is one of the most important part of Point and Figure Charting. Chart price movement sensitivity is determined by the Point and Figure scale. Large box sizes see little movement across a specific price region, small box sizes see greater price movement on P&F chart. There are four different box scaling with this tool: Traditional, Percentage, Dynamic (ATR), or User-Defined
4 different methods for Box size can be used in this tool.
User Defined: The box size is set by user. A larger box size will result in more filtered price movements and fewer reversals. A smaller box size will result in less filtered price movements and more reversals.
ATR: Box size is dynamically calculated by using ATR, default period is 20.
Percentage: uses box sizes that are a fixed percentage of the stock's price. If percentage is 1 and stock’s price is $100 then box size will be $1
Traditional: uses a predefined table of price ranges to determine what the box size should be.
Price Range Box Size
Under 0.25 0.0625
0.25 to 1.00 0.125
1.00 to 5.00 0.25
5.00 to 20.00 0.50
20.00 to 100 1.0
100 to 200 2.0
200 to 500 4.0
500 to 1000 5.0
1000 to 25000 50.0
25000 and up 500.0
Default value is “ATR”, you may use one of these scaling method that suits your trading strategy.
If ATR or Percentage is chosen then there is rounding algorithm according to mintick value of the security. For example if mintick value is 0.001 and box size (ATR/Percentage) is 0.00124 then box size becomes 0.001.
And also while using dynamic box size (ATR or Percentage), box size changes only when closing price changed.
Reversal : It is the number of boxes required to change from a column of Xs to a column of Os or from a column of Os to a column of Xs. Default value is 3 (most used). For example if you choose reversal = 2 then you get the chart similar to Renko chart.
Source: Closing price or High-Low prices can be chosen as data source for P&F charting.
Options for P&F Moving Averages:
Moving averages on P&F charts are based on the average price of each column. Bar chart moving averages are based on each close price. While 10-day SMA on a bar chart is the average of the last ten closing prices, on a P&F chart, a 10-period SMA is the average price of the last 10 column averages. Average price means “(ClosePrice + OpenPrice) / 2”
2 P&F moving averages are shown on the chart.
It can show Exponental Moving Average ( EMA ) or Simple Moving Average ( SMA )
Source: You can choose Close Price or Average Price as source. Default is Average Price.
“Fast Length” and “Slow Length” are lengths for two moving averages. Default values are 1 and 5.
“Fill between MAs” is the option to fill between Moving averages by predefined colors 'Lime/Blue', 'Lime/Red', 'Green/Red', 'Green/Blue', 'Blue/Red'
There are alerts when Fast MA crossover or crossunder Slow MA. While adding alert “Once Per Bar Close” option should be chosen.

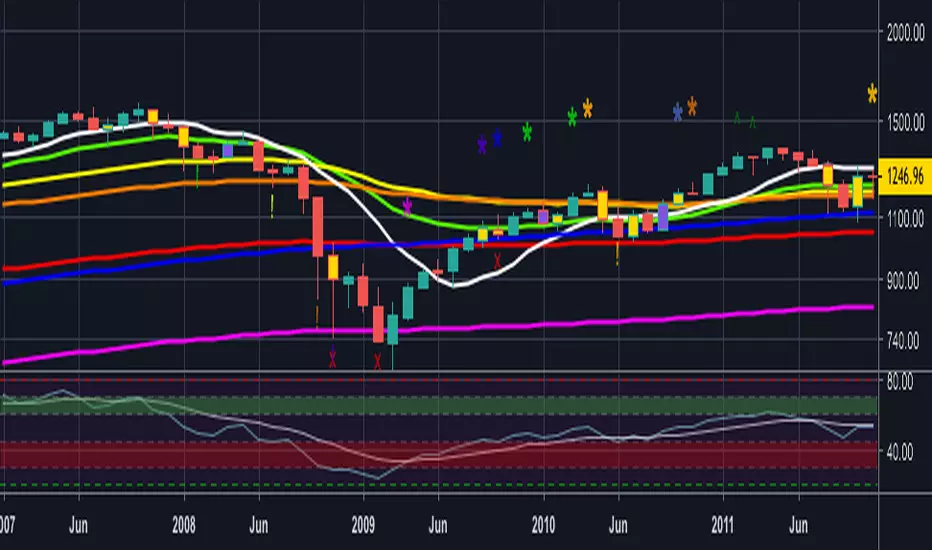
Trabalza Special
EMA/MA crosses
Bullish cross = green "^"
Bearish cross = red "x"
Golden cross (50EMA > 200EMA) = Golden circle
Death cross (50EMA < 200EMA) = Red circle
Rejections
Bullish Wick through support = Gold candle
Bearish Wick through resistance = Purple candle
Bull entries
1st candle to open and close above EMA/MA
marked by "*" above candle, colour co-ordinated to match moving average
Bear entries
1st candle to open and close below an EMA/MA
Marked by "!" below candle, colour co-ordinated to match moving average
MA + EMA Crossover EMA and MA crossovers are good signals fo trend reversal
You can look at my other scripts.
www.tradingview.com
If you want to ask something, you can message me.

Domino EffectThis illustrates the domino effect of crossing emas to establish changes in Trend State.
Each Ma has been colour coded to show when its increasing vs decreasing or stagnate
Watch and count the FAST MA crosses over the slow MA crosses to recognise changes in trend

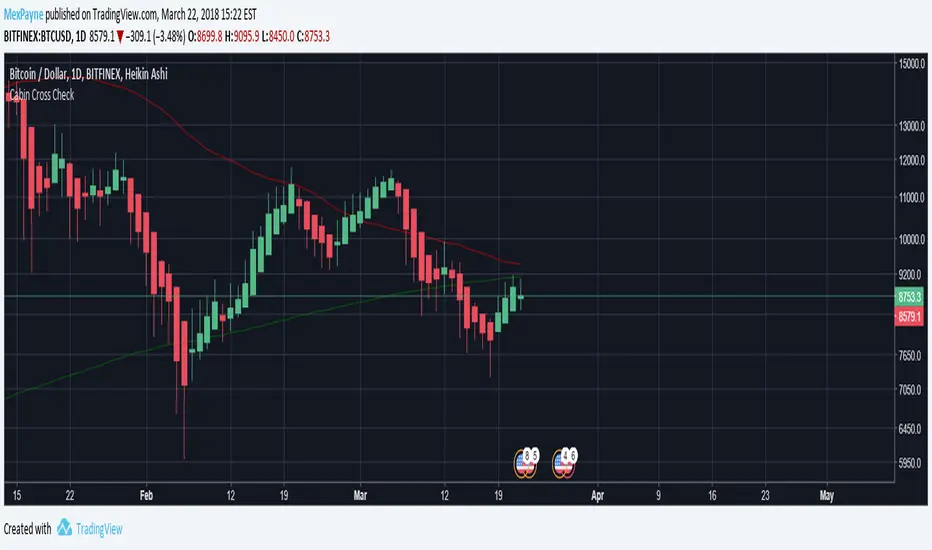
Death Cross - 200 MA / 50 Cross CheckerBITFINEX:BTCUSD
You can check if 200 day MA crossed by 50 day MA. Nuff said.
Multiple Moving AverageSuper simple script integrating three moving averages within only one script. It's going to help you to keep your chart cleaner while saving two spots for other indicators you may like. Try it out and let me know what you think.
A possible trading strategy:
Buy/Sell crossover of the MAs. Buy/Sell when fast MA crosses medium MA, double down when medium MA crosses slow MA.
Combining trading strategy is always a good idea.
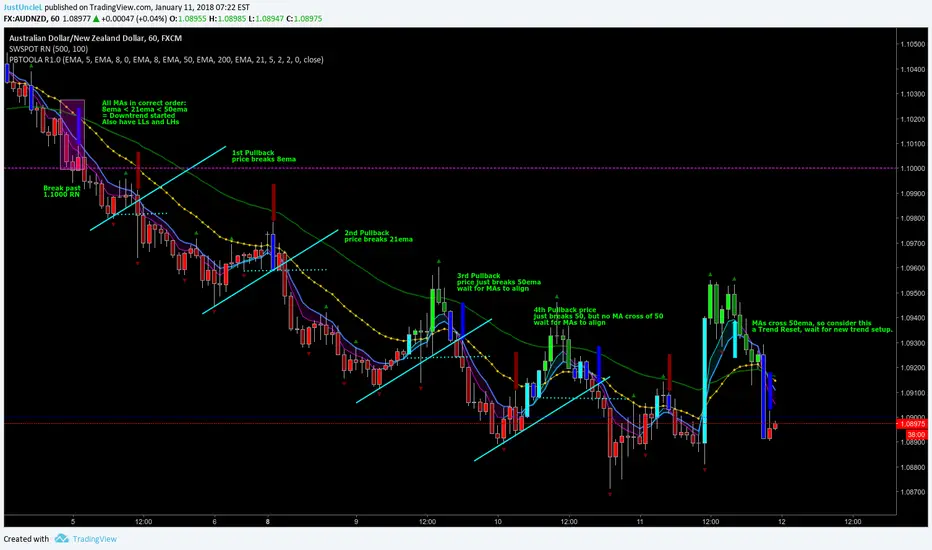
Pullback Trading Tool ALT R1.0 by JustUncleLThis study is an alternative Pullback Tool to my previous versions "Pullback Trading Tool R#.# by JustUncleL". This version aims to provide a cleaner but powerful trading tool. It incorporates the majority of the indicators needed to analyse trade Trends for Pullbacks and Reversals. You can optionally use Heikin Ashi candle or Renko charts. The notes here are mainly in reference to using standard Candlestick 60min signal chart (or Anchor chart time frame), other higher time frames can be used instead as Anchor Time Frames such as 240min(4hr) or 1440min(Daily).
NOTE: A Pullback is synomous to Retracement, generally a Pullback refers to a large Retracement of 100pips or more. In the context of this Tool and any comments related to it, a Pullback will be the same as a Retracement.
Incorporated within this tool are the following indicators:
1. Three Moving Averages (EMA by default) that can optionally be Anchored to a Higher Time Frame:
DodgerBlue = EMA08 (default)
Green = EMA50 (default)
Gray = EMA200 (default), disabled by default.
2. One Anchored Signal Moving Average line Yellow EMA21 (default).
3. Two Un-Anchored Moving Averages as Ribbon, can be disabled.
Aqua = EMA03 (default)
Fuchsia = EMA08 (default)
4. Display Pivots and optional Pivot Levels. By default Pivot is set to : 2 candles RHS of Pivot and 2 candles LHS of Pivot; this is the setting required to show standard Fractal points.
5. Optional HH, LH, LL, HL finder to help with drawing Trend lines and mini Trend Lines.
6. Coloured coded Bar based on the signal MA:
the Standard candle colours:
Blue = candle open and closed above signal MA.
Red = candle open and closed below signal MA.
Yellow = Candle stradle across signal MA.
the Grab candles scheme:
Lime = Bull candle open and closed above signal MA.
Green = Bear candle open and closed above signal MA.
Red = Bull candle open and closed below signal MA.
DarkRed = Bear candle open and closed below signal MA.
Aqua = Bull candle closed across signal MA.
Blue = Bear candle stradle across signal MA.
7. Alert entry arrows generated within a Trend or at the start of a new trend.
An Uptrend is defined as anchored fast (8ema) above anchored signal (21ema) above anchored medium (50ema).
A Downtrend is defined as anchored fast (8ema) below anchored signal (21ema) below anchored medium (50ema).
A Pullback generates an red (short entry) or green (long entry) arrow when price crosses anchored fast or signal MAs and then crosses back to return to trend direction.
A Trend Break, which is defined as any of the MAs crossing breaking trend, generates a blue (short) or aqua (long) arrow and then make new trend (in same or new trend direction).
US & EU Airlines Basket Analysis This Pine Script v5 indicator is a multi-faceted analysis tool designed primarily for monitoring the collective sentiment and technical health of a basket of US and EU airline stocks. It overlays this basket analysis onto the chart of a single security, using advanced metrics like moving average (MA) crosses, Volume-RSI scoring, broader market indices, and oil price action to generate a Combined Sentiment Index and projected Strike Price targets.
1. ⚙️ Core Logic and Calculations
The script performs three main categories of analysis: A. Airline Basket Analysis (US & EU): The core of the indicator calculates the sum of prices and moving averages (9-period and 50-period Simple Moving Averages) for the European and US airline baskets separately. Basket Signal: A signal is generated based on the relative difference between the basket's total 9-period MA and its 50-period MA. Signals (Strong/Medium/Weak): Defined by user-set thresholds, if the following conditions are met simultaneously: Buy: Price increases, Volume is above average, and RSI is in the upper half. Sell: Price decreases, Volume is above average, and RSI is in the lower half. The Net Vol/RSI Score (sum of all individual scores) is displayed on the chart labels. B. Combined Sentiment Index: This index is a weighted aggregation that consolidates all major influences into a single plot line positioned relative to the visible price range. Metrics and Influence: The index includes the Basket MA Score (directional strength of MAs), Basket Vol/RSI Score (momentum-backed moves), Main Chart RSI Score (momentum of the current symbol), Index Bias (influence from DJI, S&P 500, and NASDAQ), DXY Influence (USD Index breakouts), Oil Influence (Inverted change of Brent crude oil price, reflecting fuel costs), and a Vol/RSI Bonus for extreme scores. The final index determines the position and color of the plot line, with a sensitivity factor to control movement away from the anchor. C. Oil Inflection Points: This logic compares large moves in the Brent Crude Oil price against simultaneous large moves in the Focused Airline Basket on a user-defined, higher timeframe (e.g., Daily). Inverse Inflection (Yellow Line): Signals when Oil and Airlines move in opposite directions, confirming the expected inverse relationship (e.g., Oil \uparrow & Airlines \downarrow). Direct Inflection (Blue Line): Signals when Oil and Airlines move in the same direction, suggesting the inverse relationship is currently broken.
2. 📊 Visual Outputs and Signals
Basket MA Lines: Overlaid on Price (Green for EU, Blue for US Total MAs). Basket Signals: Below/Above Bars with Labels (EUs/USs, etc.) indicating MA cross strength. Sentiment Plot: User-defined Anchor line with a superimposed line colored Lime (Bullish) or Red (Bearish) representing the Combined Sentiment Index. Strike Price Line: Overlaid on Price as a Solid White line, an estimated near-term target price projected from the sentiment strength. Indices Table: Located at the Bottom Center, displaying real-time percentage change and alerts for the major US stock indices. Oil Inflection: Overlaid on Price as Thick Yellow/Blue Lines highlighting bars where the oil/airline relationship is confirmed or broken.
3. Adjust Inputs: Open the indicator settings (the gear icon) and adjust the included regions ("Include EU/US Airlines") and the Oil Inflection Timeframe (use a higher timeframe like 'D' for Daily for more significant signals).
4. Interpretation: A Sentiment Plot line moving significantly above the Anchor (Lime) indicates strong bullish conviction; moving below (Red) indicates strong bearish conviction. The white Strike Price Line provides a potential short-term target.
Oil is included as a feature with this indicator to assess if any possible relevance exists or seems to exist as relationship with price action value of the air travel asset class conversely or inversely: which is presented by blue and yellow bars.
